
Trading Strategies
EMA-SMA Crossover strategy for traders
Learn EMA-SMA crossover strategy to confirm entries and exits, and improve accuracy in trading decisions.
Verse Credit17 Feb 2026, 04:33 pm
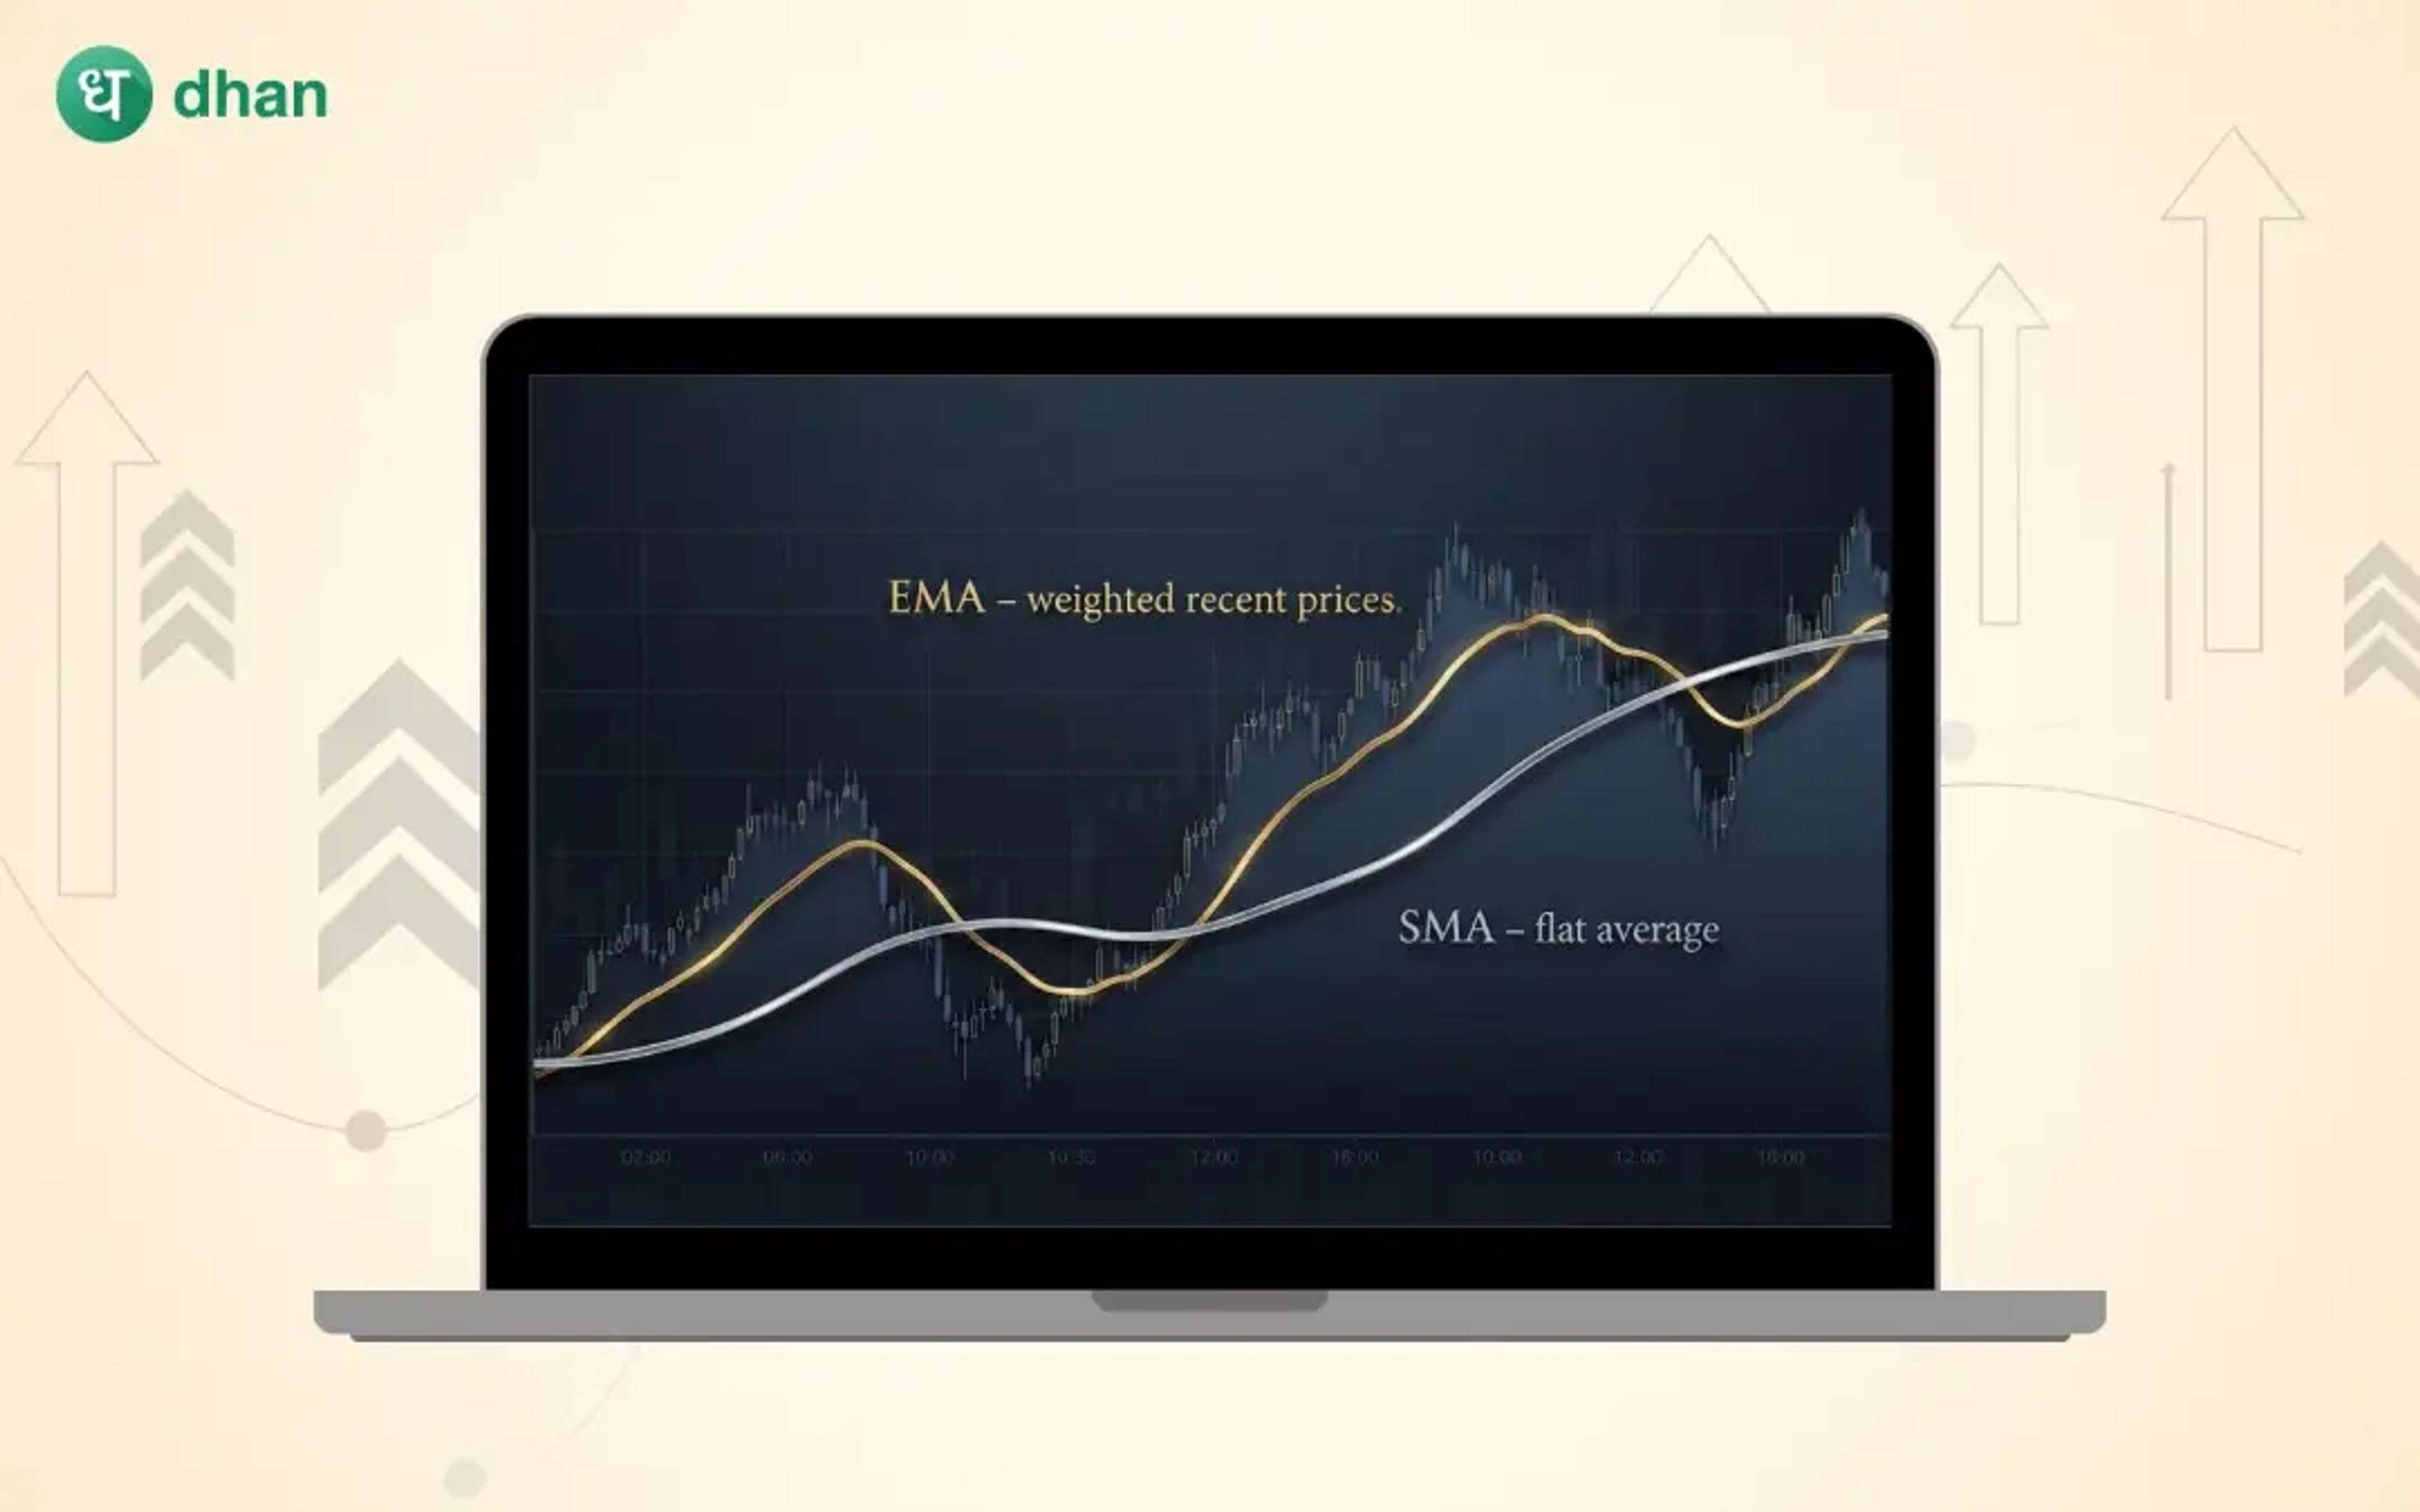
Table of Content
- What is EMA and SMA?
- What is the EMA SMA crossover?
- Why Traders Prefer the EMA-SMA Crossover Strategy
- And, it’s a wrap
- FAQs
- Bonus pages
The shrewdest traders often look for patterns that indicate the trend. Whether a trend is breaking out or reversing, catching it early helps them time their entries and exits so they can make the most of the ensuing momentum. One of the most common ways of identifying these shifts in momentum is using two types of moving averages - EMA and SMA. In this blog, we will cover more about EMA SMA Crossover.
What is EMA and SMA?
While EMA and SMA are technical indicators of momentum, their approaches are slightly different.
Exponential Moving Averages (EMA) is an average of recent prices, but with more weight given to recent prices. That makes it quite sensitive to new price changes.
Simple Moving Average (SMA) is a flat average of recent prices, with no weightage given to any specific timeframe.
SMA removes short-term noise, giving traders a wider look at the market trend.
What this means is that EMAs react faster to price changes, while SMAs are used to identify long-term trends. If SMAs are a yacht, EMAs are the jet skis attached to the yacht. Individually, both are great, but together, you can travel the high seas and waddle around in the backwaters and lagoons.
Both EMA and SMA can be short- or long-term, depending on the period of reference. 9 to 21-day periods are generally considered short-term, while 50 to 200 days are considered long-term.
What is the EMA SMA crossover?
The EMA-SMA crossover happens when you plot an EMA and an SMA on the same chart, and they intersect. When these two lines cross, traders get a sense of the market trend.
Before we plot the lines on a chart, we must choose EMAs and SMAs, and then plan entries and exits. This is how you should go about it:
Choose EMAs and SMAs
There’s no universal standard for choosing your EMAs and SMAs, but these combinations have proven their efficacy:
9 EMA + 20 SMA
20 EMA + 50 SMA
50 EMA + 200 SMA
Shorter EMAs are very sensitive to new changes in momentum, while the longer EMAs are indicative of the stable, long-term trend.
Identify the Crossover
There are two types of crossovers to look out for:
- Bullish crossover: When the EMA crosses above the SMA, it points to a possible uptrend.
- Bearish crossover: When the EMA crosses below the SMA, there is a weakening of momentum and a possible downtrend.
Confirm with Volume or Support/Resistance
Moving averages work best in trending markets because the overall direction of the market is clear. But in choppy or sideways markets, there can be a lot of false signals. That’s why it’s recommended to check the validity of the signal by also checking volume and support and resistance levels.
If the crossover happens with high volume, then the momentum is likely to be real.
If the crossover happens near a support level or a resistance level, then see if the price actually breaks out to confirm the signal. If it reverts to either the support or resistance level, then the momentum is still weak.
Plan Entries and Exits
This is the simplest approach:
- Enter long when EMA crosses the SMA and price stays above both.
- Exit when EMA crosses below SMA.
- Enter short when EMA crosses below SMA in a downtrend.
- Exit when EMA crosses back above.
Use stop-losses as crossovers are known to produce whipsaws in sideways markets.
Why Traders Prefer the EMA-SMA Crossover Strategy
Here is why traders prefer the EMA SMA Crossover.
Easy to understand
No complicated calculations required here, and it is easily identifiable on a chart. So, beginners and professionals, both can use this.
Reduces noise
Unlike EMAs that can be too sensitive to recent price changes, combining them with SMAs cuts out the noise and gives a clearer, smoother signal.
Works across markets
Stocks, commodities, indices, or forex, EMA SMA Crossover works across liquid market types.
Structured and repeatable
Because it’s visually intuitive and clearly defined, traders do not have to rely on gut feeling. It gives a clear signal with no guesswork, which can make trading a repeatable process.
On Dhan, you can trade with EMA and an SMA on TradingView charts. Identify the crossover and confirm with volume data. You can also use additional signals such as MACD or RSI, and quickly execute your trade. You can also back-test on past market data to understand how your crossover performs.
And, it’s a wrap
Traders can combine the stability of simple moving averages with the quick responsiveness of exponential moving averages to reduce market noise and spot clear changes in momentum.
While no strategy is foolproof, this is a powerful tool nonetheless to help you make thoughtful decisions. You can also try Dhan’s superfast order placement and user interface will bring confidence to your process.
FAQs
1. What timeframes work best for the EMA-SMA Crossover?
Intraday traders prefer short timeframes, so they use 5- to 15-minute charts with 9 EMA and 21 SMA crossover. Swing traders can use the hourly chart with 20 EMA and 50 SMA crossover.
2. Does the EMA-SMA Crossover guarantee accurate signals?
The EMA-SMA Crossover cuts out the noise from EMAs and brings the stability of SMAs, resulting in a balanced and fairly reliable signal.
3. Which EMA and SMA settings are most popular?
Many traders start with 9 EMA, 21 SMA for momentum. Long-term traders tend to use 50 EMA and 200 SMA.
4. Can the EMA-SMA Crossover be used with RSI or MACD?
Yes, using the EMA-SMA Crossover with other indicators can help reduce false signals and increase confidence in your trade decisions.
5. Is the EMA-SMA Crossover good for beginners?
Yes, it is one of the easiest trend systems to learn. With some practice, beginners can quickly identify shifts in momentum.